Wednesday, April 14, 2021

A Shot in the Dark: UK Policy Based on the Output Gap

Jessica Ullom-Minnich & Skyler Ramirez-Ortiz

In early March, the UK announced its budgetary plan for the coming years. The plan, which was expected to be largely contractionary, reversed its plans in light of the impact that both Brexit uncertainty and continued pandemic lockdowns have had on the economy. The Office of Budget Responsibility (OBR) has revised its expectations of future growth. It now anticipates growth of “4% in 2021, down from 5.5% in the previous forecast, but then... 7.3% in 2022, the fastest rise in eight decades.” In response to these estimates, the new budget includes expansionary policies like an extended Coronavirus job retention plan and increased grants and low-interest loans. On the whole, the plan is expected to increase spending by about £35 billion and cut taxes by an additional £24 billion. This is effectively an increase of 3% of GDP, not counting multiplier effects. The OBR has added that they hope these measures will close the negative output gap in the UK economy. In a few years time, as output grows substantially, the government is expected to raise taxes to the highest levels since the 1960s.

The IS-LM-PC model provides valuable insights into the logic behind this policy. To set up this analysis, assume an economy in medium-run equilibrium before Brexit/Covid-19 lockdowns. We know that both Brexit and Covid-19 have likely shifted the IS curve inward. Brexit decreased business confidence and thus investment, while lockdowns caused many to lose their jobs and reduce their consumption. In the short run, this creates a new equilibrium with higher interest rates and lower output, provided monetary policy does not change. However, a medium-run perspective requires knowledge of the position of the Philip curve. For example, if new tariffs raised the prices of important raw materials, businesses would have to use larger markups to afford their inputs. This would shift the Phillips curve upward. If the shift was significant enough, the UK economy could already be in medium-run equilibrium- even with the reduced output. This would mean that expansionary policy could only result in a temporary increase in GDP that would bring with it a large increase in the inflation rate. However if, on the other hand, the Phillips curve has remained where it originally was, then the action from the OBR may be able to force the IS curve out again and quickly reestablish equilibrium with a minimal change in inflation. Even as UK policymakers look toward the future, the consideration of medium-run equilibrium still applies. The article suggests that in several years when economic growth is high again, taxes will be raised substantially. If policymakers manage to get the economy back to equilibrium before this dramatically increased growth, higher taxes could prevent the IS curve from shifting out and moving the economy out of equilibrium once more. However, if the economy has not yet fully recovered and the output gap is still negative, the increased taxes would be counterproductive. The government’s ability to be effective in any of this relies on its ability to effectively predict where the Phillips curve is. More precisely, they need to determine exactly how large the output gap, the difference between current output and potential output, is.

The data table above was taken from the UK Treasury’s website. It lists several independent estimates for what the output gap currently is (as of Feb 2021) and also what it will be as far into the future as 2025. Particularly of note is the diversity of the measurements. According to the table, the current UK output gap could be anything from -5.2% to 7.5%. Taken in comparison with the OBR’s estimate at the bottom of the page (-1.1%) it is apparent that the eventual impact of policy based on the predicted output gap is anything but certain. The fundamental problem is that “despite their policy relevance, output gaps are notoriously difficult to measure (especially in the vicinity of a large shock...), and there is no consensus in the profession on the best method for estimating them.” Traditionally, the primary methods for estimating potential output have relied on “decomposing observable output ... subject to various assumptions.” Naturally, problems occur when there are either issues with these assumptions or the observable data itself. In fact “endpoint problems” in which current data is being constantly revised, are very common in most models. One new method attempting to compensate for this issue is the method used by Marko Melolinna and Mate Toth in their paper that uses financial variables -in addition to traditional ones like real GDP- as signals for the business cycle to better predict real-time output gaps. This is based on the logic that the financial system can either “act as an amplifier of shocks or can be the source of shocks that trigger business cycle fluctuations in the first place.” On the whole, this new model presents a view of the UK’s economy that tends to have a more optimistic view of the UK output gap in the post-2008 financial crisis world. This is because in the model a “larger part of the crisis-related downturn is attributed to cyclical rather than structural factors.” The results of this study, while promising, still have progress to make. Some of their results (pictured below) show their model’s real-time estimates of the output gap compared with the full sample predictions. Even though these estimates generally trend together, they are often different enough that a policy based on the real times estimates could significantly miss the mark and mistakenly under-account or over-account for the output gap. What this means in the context of the UK’s new budget plan is that the OBR’s estimates of the output gap are very likely to be flawed in some respect. If policymakers were to wait long enough to be more confident in the output gap estimates, it would already be too late to take action off of them. There is simply too much diversity among estimates of the current output gap and an empirical discrepancy between real-time estimates and ex post facto estimates of the output gap. Even if the fiscal policy is headed in the right direction, miscalculation means there is a high likelihood of seeing the UK’s inflation rate change in the near future as they get closer and closer to closing the output gap.


Bibliography


"A Game of Two Halves." The Economist, Mar 06, 2021, 21-22, https://ezproxy.plu.edu/login?url=https://www-proquest-com.ezproxy.plu.edu/magazines/game-two-halves/docview/2497407324/se-2?accountid=2130.


Blanchard, Olivier. Macroeconomics. 7th ed. Boston, MA: Pearson, 2017.


Macroeconomic Co-ordination and Strategy Team, The. "Forecasts for the UK Economy: A Comparison of Independent Forecasts." February 2021. Accessed April 11, 2021. https://assets.publishing.service.gov.uk/government/uploads/system/uploads/attachment_data/file/962029/Forecomp_February_2021.pdf


Melolinna, Marko, and Mate Toth. “Output Gaps, Inflation and Financial Cycles in the UK.” Empirical Economics 56, no. 3 (March 2019): 1039–70. https://search-ebscohost-com.ezproxy.plu.edu/login.aspx?direct=true&db=ecn&AN=1757826&site=ehost-live&scope=site.


Monday, April 12, 2021

The She-Cession: The Disproportionate Effects of the Pandemic on Women in the Workforce

Hanna Venera & Holden Smith


In the wake of the COVID-19 pandemic, the world has witnessed a wide variety of adverse effects, most notably in the economic sectors. One aspect of the pandemic that has received little attention is the disproportionate effects felt by women as compared to men with regard to employment and the workforce. Not only are women losing jobs “at a steeper rate than men,” but women are also having a harder time returning to work (Chaney, 2020). In fact, Furmans (2021) explains that “women’s participation in the labor force has slipped to 57%, the lowest it has been since 1988.” Why might this be? Economists argue that women are simply falling out of the US labor force due to the uneven burden this pandemic has exacerbated by gender. Comparing pre and post-pandemic, Chaney and Weber (2020) report that in February 2020, both men and women had similar unemployment rates near 3.5%; however, in May 2020, the rates were significantly different, with men at 13.5% and women at 16.2%. As we discussed in class, these numbers are accounting only for those actively seeking employment, which shows that more women are seeking employment and participating in the workforce than historically. However, the high rate is still problematic, as it can have a lasting impact on both these women’s professional careers and bargaining power in this economy. Women of color have been even more disproportionately impacted by this pandemic, as compared to white women, with 20.2% unemployment for Hispanic women, 16.4% for black women, and 15% for white women (Chaney & Weber, 2020). As anyone who faces unemployment during a recession is at risk of not returning to the workforce, we might see adverse effects in the communities that are being impacted most heavily, in this case women, most notably women of color. Further, in their econometric analysis, Dang and Ngyen (2021) found that “Women are 24 percent more likely to permanently lose their job compared to men… and expect their labor income to fall by 50 percent more than men do” (p. 2). Women before this pandemic were already facing tremendous obstacles, including the pay gap; this pandemic has only expanded these inequalities. This pandemic and the actions of the world's government have targeted the sectors in which women are the most prevalent, turning this period into a she-cession.


Figure 1: Unemployment Data by Gender, 2000-2021

Source: St. Louis Fed, https://fred.stlouisfed.org/series/LNS14000002


This disproportionate shock by gender skewed in favor of men is actually the opposite of past recessions. In previous recessions men showed higher rates of unemployment because of their high proportion of workers in sectors that usually felt the brunt of layoffs and wage decreases, such as manufacturing and construction; this time has been different (Chaney & Weber, 2020). Stephani Albanesis, an economics professor at the University of Pittsburgh jokes that “every recession is a ‘mancession’ except this one” (Chaney & Weber, 2020). When breaking down the cause of this unique instance in history, we must examine the context of the COVID-19 pandemic and what it has impacted the most strongly. As a result of social distancing and quarantine restrictions, the service industry (including the food industry, healthcare and nursing, or childcare) has felt the brunt of these economic shocks, many of which employ a large percentage of women -- about 77% according to Chaney & Weber (2020). This means that the unemployment rates within the service sector are higher than other economic sectors, which translates to workers within that sector as more replaceable, many of which are women. As explained by Dang and Ngugen (2021), “The COVID-19 pandemic differs from a typical economic recession since it can more strongly affect sectors with high female employment shares” (p. 1). Interestingly enough, this high proportion of women in the service sector created an opportunity for “women [to hold] a higher proportion of US jobs than men for the first time in nearly a decade;” however, since the pandemic and the disproportionate job losses, this proportion has flipped, such that men compose the majority of the workforce once again (Fuhrmans, 2021). This returns to how the unemployment rate is defined. As the rate is determined only by those actively searching for jobs, this higher number has both implications of progress for women composing a larger portion of the workforce, but also losing jobs involuntarily at a higher rate.


Figure 2: Sex and Race by Economic Sector, 2020

Source: US Bureau of Labor Statistics, https://www.bls.gov/cps/cpsaat18.htm


Looking to the future, we must consider the potential long-term implications of women leaving the workforce. Chaney (2020) argues that the decline in the female workforce could lead to a rise in household income inequality. In this day and age, it is difficult to support a family with only one income, increasing the number of households with two breadwinners. With an increasing number of women losing jobs as a result of the pandemic’s effect on the service sector, families are losing a second source of income (and sometimes their only source in the case of single parent households). Chaney (2020) explains that in past recessions, “married women... took jobs to offset lost wages when their husband or male partner was laid off… [but now] are less likely to seek work because their employment prospects are... limited.” In essence, the women who have left the workforce may be taking a more permanent leave than they initially realized. Economists have also discussed this disparity in context with a term called “hysteresis,” such that “the longer women remain out to the labor market, the harder it could be to return” (Chaney, 2020). This idea stems from the notion that being removed from the workforce results in a lack of practice and employment of certain skills required, causing women to be perceived as less hireable, or if they are hired, could be seen as less valuable, causing a drop in benefits or pay. This connects to the relationship between wages and the unemployment rate, as this concept is an example of bargaining power in the workplace; when the unemployment rate is low, workers have a higher bargaining power, which raises the efficiency wage required to retain workers. In the wake of the pandemic, unemployment rates are conversely low, resulting in low bargaining power and lower wages overall, since replacing a worker is relatively inexpensive for the employer. This means that even if women are able to find jobs, they are difficult to retain, and would not have the same financial support as prior. Finally, school and child care closures have also played a large role in women returning to work (Chaney, 2020). As Titan Alon, an economics professor at the University of California San Diego explains, “if you have to take care of your children eight hours of the day when they would have been in school… how could you literally work a full-time job as well” (Chaney, 2020). Overall, this pandemic has caused a recession unlike any other historically, in that women have felt an overwhelming brunt of the economic impacts, as the service sector has been disproportionately targeted. As economists continue to study the impacts of the pandemic, this disparity should be considered, especially in context of long-term impacts on the economy and women’s place within it.


Works Cited

Chaney, S. (2020, June). Women's Job Losses From Pandemic Aren't Good for Economic Recovery; Squeeze on jobs and continued child-care responsibilities are expected to pose setbacks to female employment as businesses start to reopen. Wall Street Journal.

Chaney, S., & Weber, L. (2020, May). Coronavirus Employment Shock Hits Women Harder Than Men; Women are more likely to work in vulnerable sectors like retailing and personal care. Wall Street Journal.

Dang, H. H. & Nguyen, C. V. (2021). Gender inequality during the COVID-19 pandemic: Income, expenditure, savings, and job loss. World Development, 140(105296). https://doi.org/10.1016/j.worlddev.2020.105296

Fuhrmans, V. (2021, March). International Women's Day Caps a Year Like No Other for Working Women; How women are coping with Covid-19 and the long-term impact the pandemic could have on their careers longer term. Wall Street Journal.

Wednesday, March 31, 2021

How Does Government Stimulus Affect Unemployment?

    Sadie Brownlee and Charlie Cutter


A prevalent topic in the news during the pandemic has been skyrocketing unemployment across the world and numerous governmental tactics to combat it. The threats of high unemployment on the employed and the searching are twofold: fewer jobs available mean people are less likely to find a job, and that employed people are at more risk of losing their jobs (Blanchard). Thus, governments should keep their unemployment rate low and maintain employment to avoid great economic shocks that have the potential to spiral. For reference, the Great Recession saw a peak close to 10% unemployment, with the percent unemployed finding a job dropping from 28% to around 17%. 


Fig. 1 - The Unemployment Rate and the Proportion of Unemployed Finding Jobs, 1996-2014


Source: Blanchard 142


Fig. 2 - The Unemployment Rate and the Monthly Separation Rate from Unemployment, 1996-2014


Source: Blanchard 143


Government stimulus directed towards the unemployed reduces the decline in real wages. Higher unemployment leads to lower real wages as workers have a weaker bargaining position (Blanchard). Unemployment insurance makes unemployment less painful and reduces the drop in real wages by allowing the worker some or more of their prior wage, in the case of added stimulus. By providing some of the worker’s previous wages, the drop in consumer demand is dampened, decreasing unemployment’s adverse effects on the economy. The Great Depression was the catalyst for the establishment of unemployment insurance in the US, where estimates place unemployment higher than 20 percent (Pells).


Fig. 3 - Unemployment Rate, Seasonally Adjusted        


Source: Australian Bureau of Statistics


Fig 4. - Changes in payroll jobs, mid‑March to end‑May 2020  (indexed)


Source: Australian Government


Similar to graphs we have seen from the United States, the Unemployment Rate of Australia skyrocketed during the pandemic with a peak of 7.5% in July of 2020. The pre-pandemic rate in February of 2020 was 5.1%. JobKeeper is a wage subsidy program implemented by the Australian government designed to give businesses the ability to maintain their employees’ wages without laying off many, if any (Australian Government). It is one of many ways governments are attempting to curb rising unemployment. As Fig. 4 demonstrates, unemployment plateaued after the introduction of JobKeeper.  After a year and over $68 billion spent, the Australian government is terminating the program, inciting alarm from some and relief from others (Heath). Some Aussies believe the program has been successful and does not need to continue (Heath). Throughout 2020, 875,000 new jobs were created, with only one month where jobs were lost (Heath). This month of contraction, September, coincided with the Australian state of Victoria’s second wave of COVID-19 (Heath). Economists suggest this overall growth will absorb any loss the country will incur upon the end of the subsidy (Heath). However, not everyone is so convinced. According to Diana Mousina, senior economist at AMP Capital Investors Ltd, 1.3% of the workforce is underemployed, indicating that the economy has much more room for growth under the protection of JobKeeper (Heath). Without it, this portion of the workforce is at a high risk of unemployment (Heath). Some economists land in the middle, stating that broad wage subsidies should end, but more targeted stimulus should continue (Duke). But will targeted stimulus provide as much relief as people hope?


A study conducted by Ursula Jaenichen and Gesine Stephan suggested targeted wage subsidies for “hard-to-place” workers, such as those who have been unemployed for extended amounts of time or disabled people, can stimulate employment but can also be associated with some deadweight loss (Jaenichen). They found the share of “hard-to-place” workers that took on a subsidized job, as opposed to remaining unemployed, was 25-42% greater than their unsubsidized counterparts (Jaenichen). In other words, 25-42% of those employed in a new job after being introduced to the workforce through subsidized employment would not have been employed without this opportunity (Jaenichen). However, compared to those that went straight into unsubsidized employment, rather than beginning with a subsidized job and transitioning out, the latter was not better off than the former and incurred a deadweight loss (Jaenichen). Therefore, their study found that being employed through a subsidized program is much better than being unemployed but not any better than having an unsubsidized job (Jaenichen). For Australia, this study supports maintaining wage subsidies, i.e., the JobKeeper program, for people who would not otherwise be able to find employment. For those that can easily find a job, wage subsidies are unproductive.  


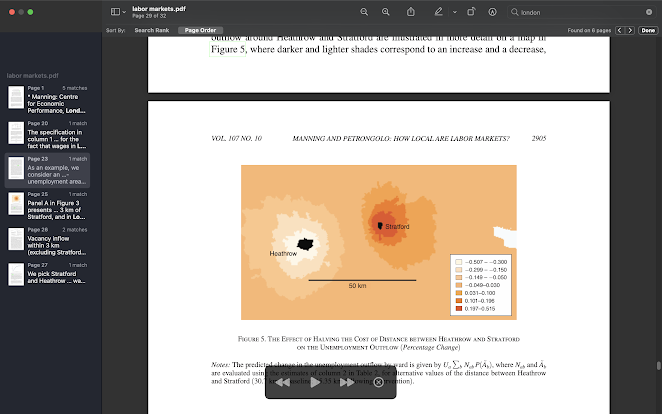
Additionally, the effects of targeted labor stimulus are challenging to isolate and quantify due to numerous measurement factors, such as defining labor markets and whether they should overlap. Manning and Petrongolo conclude that an increase in job vacancies in one area, as well as a decrease in the cost of the distance between a job and home (calculated separately and independently in their study), both radiate far beyond the targeted locale for these programs (Manning). They found that localized efforts to meet labor demand prompt people in other areas to redirect their job searches, therefore expanding the affected region, as fig. 5 illustrates for the London suburb Stratford (Manning). Manning and Petrongolo highlight that not allowing for overlapping labor markets or improperly measuring the affected zone’s size can skew results toward overestimating or underestimating the stimulus’s impact (Manning). This means that focusing aid to specific parts of Australia that need more support than others may not be as potent as necessary to prompt a strong recovery, or the data reported may not accurately reflect its impact. 


Fig. 5 - The Effect of a Doubling in the Number of Vacancies in Stratford, England, on the Unemployment Outflow (Percentage change)


Source: Manning


Fig. 6 - The Effect of Halving the Cost of Distance Between Heathrow and Stratford on the Unemployment Outflow (Percentage Change)


Source: Manning

Context: Stratford is a high-unemployment area in East London, while Heathrow is a low-unemployment area 30.7 km away or 1 hour and 20 minutes drive.


Works Cited

Blanchard, Olivier. Macroeconomics. 7th ed., Pearson Education Inc., 2017. 

Manning, Alan, and Barbara Petrongolo. “How Local Are Labor Markets? Evidence from a Spatial Job Search Model.” American Economic Review, vol. 107, no. 10, Oct. 2017, pp. 2877–2907. EBSCOhost, doi:http://www.aeaweb.org/aer/.

Heath, Michael. “End of Australia’s $68 Billion Job-Saving Stimulus Tests Economy.” Bloomberg.com, Bloomberg, 28 Mar. 2021, www.bloomberg.com/news/articles/2021-03-28/australia-pulls-job-stimulus-worth-5-of-gdp-in-test-for-economy. 

Australian Government, The Treasury. The JobKeeper Payment: Three Month Review, 21 Jul. 2020. 

Jaenichen, Ursula, and Gesine Stephan. “The Effectiveness of Targeted Wage Subsidies for Hard-to-Place Workers.” Applied Economics, vol. 43, no. 10–12, Apr. 2011, pp. 1209–1225. EBSCOhost, doi:http://www.tandfonline-com.ezproxy.plu.edu/loi/raec20.

Duke, Jennifer. “‘Better Ways to Provide Stimulus’: Five Top Economists Support End of JobKeeper.” The Sydney Morning Herald [Canberra], 29 Mar. 2021, www.smh.com.au/politics/federal/better-ways-to-provide-stimulus-five-top-economists-support-end-of-jobkeeper-20210329-p57evk.html.

“Labour Force, Australia, February 2021.” Australian Bureau of Statistics, 18 Mar. 2021, www.abs.gov.au/statistics/labour/employment-and-unemployment/labour-force-australia/latest-release#unemployment.

Pells, R. H. and Romer, . Christina D. "Great Depression." Encyclopedia Britannica,

September 10, 2020. https://www.britannica.com/event/Great-Depression.


Tuesday, March 30, 2021

Unionization and the Effects of Amazon's Alabama Union Vote

     As of March 29th, 2021, voting had halted in the Alabama Amazon warehouse which has quickly become the center of conversations centering on the importance of unions nationwide. Currently, around 10% of American workers have their wages set through collective bargaining, a negotiation that happens between a union and a firm (Blanchard, 2014, pg. 143). This vote holds significance as it could be Amazon’s first unionized American warehouse, and the precedent set in this case will undoubtedly affect the second-largest private employer’s 800,000 employees across the entire United States. Per the Economic Policy Institute, one can see that there is a definite correlation between union membership and income inequality (Rhinehart and McNicholas, 2020). 

Economic Policy Institute, www.epi.org/publication/collective-bargaining-beyond-the-worksite-how-workers-and-their-unions-build-power-and-set-standards-for-their-industries/

This study found that higher density of unions has positive impacts on employees who are not members of unions, and firms that have high union density despite the numerous barriers set in place through U.S. labor law to inhibit unionization have on average 5% higher wages for non-college-educated non-unionized workers, with wages 8% higher for their college-educated coworkers who were not unionized (Rhinehart and McNicholas, 2020). The reasoning for this is not known definitely, but it is theorized that this could be due to greater rates of transparency regarding wages in workplaces that have regular conversations amongst employees with unions about their wages and collective bargaining power(Rhinehart and McNicholas, 2020). This transparency begins to explain the union-busting behavior that Amazon has been accused of, with potential unionization nationwide posing a risk of increased wages that Amazon would be required to pay to its numerous employees. 

    The presence of unions improving overall wellbeing for the working class is not an isolated incidence. A study published in March of this year found that states that have fewer boundaries for the creation of unions experience higher levels of economic growth and individual earnings (Warner and Xu 2021). Despite this, union membership has fallen consistently over the past decades, especially with austerity measures on both the state and local levels since the 2007 recession (Warner and Xu 2021), likely due to the union-busting behaviors that large corporations had adopted in recent years. Claims from employees to the National Labor Relations Board regarding Amazon’s interference with their workers’ right to organize more than tripled since the beginning of the pandemic. Most recently, Amazon chose to settle after evidence emerged corroborating claims that they filed harassment charges against an employee for attempting to unionize (Solon 2021). In this settlement, Amazon was required to advertise both physically and electronically the right to organize for their workers. This did not deter Amazon from attempting to sway their workers' opinion on unionization in recent weeks (Solon 2021). Mandatory meetings were held with employees for Amazon officials to state their anti-union rhetoric, along with mailers, texts, tweets, and even Twitch advertisements being used to further their appeals for employees to vote against a union (Palmer, 2021).

    The Economic Policy Institute notes that bargaining power continues to decline for unions as enrollment decreases, and will likely continue to do so until there are systemic changes at the national level that sets meaningful penalties for interfering with workers' rights to organize and unionize. One potential piece of legislation that is aiming to protect workers is the PRO (Protecting the Right to Organize) Act, which further strengthens the ability for workers to unionize. This bill has passed in the House of Representatives but has not yet been seen by the Senate. If enacted, this bill would have prevented Amazon from having legal standing to participate in representation proceedings, captive audience meetings from Amazon would have been prohibited, and the union would have had more economic weapons such as intermittent strikes and production slowdowns to enact leverage(Magner 2021). Nonetheless, the bargaining power of these Amazon workers is evident. Amazon sales are at an all-time high during the pandemic as households opt to order online and avoid in-person shopping. The warehouse workers do much of this labor and cannot be replaced quickly enough to prevent a major financial impact on Amazon. As news reports on the massive financial gains that Amazon CEO Jeff Bezos has obtained during the pandemic emerge, workers are more confident in demanding higher wages for the labor he is profiting off of. Regardless of the outcome of the union vote in Alabama that will be announced in the coming days, the mere existence of this vote represents a changing tide of workers’ opinion on unionization, and this vote is likely to spur the organization of possible unions in the future for Amazon warehouses and other large production facilities across the country.

Works Cited

“Actions - H.R.2474 - 116th Congress (2019-2020): Protecting the Right to Organize Act of 2019.” Congress.gov, 2019, www.congress.gov/bill/116th-congress/house-bill/2474/actions. Accessed 31 Mar. 2021.

Knepper, Matthew. “From the Fringe to the Fore: Labor Unions and Employee Compensation.” Review of Economics and Statistics, vol. 102, no. 1, Mar. 2020, pp. 98–112. EBSCOhost, doi:http://www.mitpressjournals.org.ezproxy.plu.edu/loi/rest.

Magner, Brandon. “The Amazon Union Drive in Alabama Would’ve Looked Very Different under the pro Act.” Jacobinmag.com, 2021, jacobinmag.com/2021/03/amazon-union-drive-pro-act-bessemer-alabama. Accessed 31 Mar. 2021.

Palmer, Annie. “Amazon’s Aggressive PR Campaign ahead of Union Vote Shows How Worried It Is, Labor and Antitrust Experts Say.” CNBC, CNBC, 29 Mar. 2021, www.cnbc.com/2021/03/29/amazons-pr-campaign-ahead-of-union-vote-shows-how-worried-it-is.html. Accessed 30 Mar. 2021.

Rhinehart, Lynn and Celine McNicholas. “Collective Bargaining beyond the Worksite: How Workers and Their Unions Build Power and Set Standards for Their Industries.” Economic Policy Institute, 2020, www.epi.org/publication/collective-bargaining-beyond-the-worksite-how-workers-and-their-unions-build-power-and-set-standards-for-their-industries/. Accessed 30 Mar. 2021.

Solon, Olivia, et al. “Fired, Interrogated, Disciplined: Amazon Warehouse Organizers Allege Year of Retaliation.” NBC News, NBC News, 30 Mar. 2021, www.nbcnews.com/business/business-news/fired-interrogated-disciplined-amazon-warehouse-organizers-allege-year-retaliation-n1262367. Accessed 31 Mar. 2021.

Warner, Mildred, et al. “Productivity divergence: state policy, corporate capture and labour power in the USA.” Cambridge Journal of Regions, Economy and Society, March 21 2021, DOI: 10.1093/cjres/rsaa040

Thursday, March 25, 2021

The Perspective of Bond Holders and Understanding Negative Bond Yields

    The purpose of holding a portion of one’s wealth in bonds, as opposed to money, is to make a positive return from the bond’s interest payments. Bondholders don’t simply want to break even—they want to gain something from making an investment. When investors purchase bonds, they are forgoing their ability to hold money in the present, which means that they’re unable to make purchases or engage in economic transactions. Breaking even implies that the bondholder would have been just as well off had they held their wealth in money—in fact, it implies that they may have been better off because they could have made purchases (as opposed to forgoing purchases). With that being said, it’s still important to understand—in mathematical terms—what it means for a bondholder to break even.

    We begin with the concepts of risk and expected value. Because there is always a possibility of default, investors want to be compensated for this added risk—compensation that goes beyond the ordinary interest payments. We call this compensation the risk premium, and we denote it with the variable x. Furthermore, if ρ equals the probability of default, then 1- ρ equals the probability of not defaulting—i.e., the borrower pays back the entirety of the bond’s principal and interest payments. Therefore, the expected value of a bondholder breaking even is:

1+i=(1-p)(1+i+x)+p(0),

where (1 + i + x) is the bondholder’s outcome should the borrower not default. Because the outcome of a default is simply zero (the bondholder loses all their money), this equation simplifies to

1+i=(1-p)(1+i+x).

This equation implies that a bondholder is indifferent to holding a riskless bond (left-hand side) compared with a riskier bond but that includes a risk premium, x (right-hand side). Rearranging this equation, we arrive at the value of the risk premium of a break even situation:

x=(1+i)p/(1-p)

    In recent news, Portugal’s 10-year bond yield fell below zero as of November 2020. More simply, the return (or face value) of Portugal’s 10-year bond is now less than the price paid for it. According to the Financial Times article (Stubbington 2020) the reason for Portugal’s negative bond yield are largely due to the Covid-19 Pandemic. Stubbington states, “[Portugal’s] expecting output to shrink 8.8 per cent in 2020,” and, “will raise Portuguese public debt to 136 per cent of output by the end of the year.” Portugal increased government borrowing to fund their pandemic response, like most countries did during these unprecedented times. In response the European Central Bank (ECB) expanded its €1.35 trillion emergency bond “buy-back” program.

    What does it mean when bond yields fall negative? According to the “break-even” or “bond-return” equation, the premium paid on a bond (x) is inherently high due to a high probability of default;

x=(1+i)p/(1-p)

The probability of default (p) increases as the risk for holding the bond increases. This risk for holding the bond increases when the credit risk (risk of default associated with the borrower failing to make required payments) and liquidity risk (risk associated with the inability to exit your bond contract) increase. According to the peer-reviewed journal article (Li, Yang, Su, et. al 2021) unlike US-issued bonds, corporate bonds require Risk Compensation. Hence, the risk premium must reflect risk associated with holding a bond. According to the article, these two types of risk are interconnected, so there must be enough incentive (risk premium) to encourage more investment into that bond market. When Portugal increased their debt from borrowing to fund their pandemic protocols, the probability of default increased due to both credit and liquidity risk working together associated with that increased debt. With a higher risk premium (x) associated with a higher probability of default (p), the expected return on a risky asset (like Corporate Bonds) must exceed the known return on a “risk-free” bond (usually Government issued Bonds) in order to induce investors to hold the risky asset rather than the risk-free asset.

    However, what the peer-reviewed journal article from JP Morgan (Dryden 2019) points out is how negative-yield bonds are financially and economically nonsensical. This is because a logical bond investor would not buy a bond with the expectation to lose money off their investment. A purchaser of a negative-yield bond would always guarantee themselves a loss. Negative-Yield bonds occur when bonds are issued with a zero (or just above zero) coupon payment, but their selling price is higher than face value (Dryden 2019). 

     So who would want to buy these kinds of bonds that yield a negative return on investment. Dryden explains how there are two types of consumers of these negative-yield bonds. There are the “Forced Buyers” who are profit agnostic (indifferent of a positive or negative profit when buying a bond) and hold these types of bonds for reasons other than making a profit. Central Banks are a common example of “Forced Buyers” because they buy negative-yield bonds to achieve asset purchase targets (Dryden 2019). Currently the ECB owns 21% of their own government debt. The other type of consumer is “Speculative Investors.” They hold negative-yield bonds hoping that yields will continue to fall further making them a small profit from price appreciation (Dryden 2019). In some scenarios, these speculative investors invest in negative-yield bonds as a means of protection from the government they are paying off (giving profit to), however, this is a very incremental portion of the negative-yield bond market.

    Would US bond yields ever fall into the negatives? According to Dryden, it is unlikely for bond yields to fall into the negatives because unlike Japan and the EU, the US relies on their balance sheet to provide additional stimulus rather than cutting interest rates into the negatives and enacting aggressive asset purchasing schemes. However, Dryden stresses the fact that if the FED were to cut interest rates to its record low (0.25%) and restart its bond purchasing programs, bond yields would likely lower (Dryden 2019). He goes on to say, “combined with weak outlooks for the economy and inflation, the resulting forces may be enough to drive Treasury Yields negative.”


Works Cited


Dryden, A. (2019). Entering uncharted waters: Understanding negative bond yields. JP Morgan 

Market Insights, 1-5. Retrieved March 25, 2021, from 

https://am.jpmorgan.com/blob-gim/1383637630519/83456/MI-MB%20Negative%20Bond

%20Yields.pdf


Li, X., Yang, B., Su, Y., & An, Y. (2021). Pricing corporate bonds with credit risk, liquidity risk, 

and their correlation. Discrete Dynamics in Nature and Society, 2021 

doi:http://dx.doi.org.ezproxy.plu.edu/10.1155/2021/6681035


Stubbington, T. (2020, Nov 27). Portugal's 10-year bond yield drops below zero: Fixed 

income. Financial Times Retrieved from https://ezproxy.plu.edu/login?url=https://www-proquest-com.ezproxy.plu.edu/newspapers/portugals-10-year-bond-yield-drops-below-zero/docview/2472941443/se-2?accountid=2130


Thursday, March 18, 2021

Expansionary Monetary and Fiscal Policies within the IS-LM Model: Should We Be Worried About Inflation?

In a recent article by the US News, Jerome Powell, Chair of the Federal Reserve, stated that despite the anticipated growth in inflation in the coming months, the Federal Reserve will maintain its low-interest rate policies (“Powell”), citing that such inflation is likely to be temporary. Should we be more worried than Powell is about this? While what Powell says may be true, let us dive a bit deeper to understand why his lack of concern may be well placed concerning potential future inflation. To begin, we shall investigate the actions of Powell’s Federal Reserve as of recent, altogether what can be defined as monetary policy. Until the pandemic started in March 2020, the Federal Reserve was gradually increasing the federal funds rate (from here on referenced as interest rate), but reversed course by decreasing interest rates rapidly in response to the economic downturn caused by the pandemic.

 (“Effective Federal Funds Rate”)


This lowering of the interest rate is called expansionary monetary policy, which means that it encourages economic growth. A model that can be used for understanding this is the IS-LM model, which models the interaction between the goods and financial market. The LM curve is a horizontal line that represents the interest rate. During expansionary monetary policy, when the interest rate decreases, the LM curve shifts down:

  (Blanchard 98)


The downward shift in the LM curve increases equilibrium output. The Federal Reserve changes the interest rate by changing the money supply. To do so, the Federal Reserve buys bonds, paying for them with printed money, which then increases the money supply—the nominal amount of money within the economy (Blanchard 74). This lowers the interest rate as, with a greater supply of money but (all else equal) the same demand for money, the cost incurred by someone who takes on a loan (such as the interest rate) decreases as competition for the supply of money is eased (Blanchard 72).

         Another component for us to understand in our analysis is not only monetary policy, as just mentioned, but also fiscal policy. President Biden recently signed a $1.9 trillion pandemic relief bill, which has within it a $1400 direct payment to individuals that make under $75,000 a year (Pramuk). Government transfers, such as these stimulus checks, do not directly contribute to economic growth in the form of increasing GDP. They do, however, impact consumption expenditures, which is a large component of GDP (Blanchard 49-52). This is because these transfers increase individual disposable income, which in turn allows for increased consumption. Individual marginal propensity to consume, which is the effect an additional dollar of disposable income has on consumption (Blanchard 51), is currently around 50% (Karger & Rajan). This value indicates that the stimulus checks will then likely have a large impact on consumption expenditures, and in turn, GDP. Additionally, households with low levels of liquidity (ability to turn current assets into money quickly) or who are lower-income tend to positively change their consumption levels more strongly in response to stimulus checks than other households (Baker et. al. 4). Thus, as these stimulus checks roll out, we should not only expect that an increase in output would happen as people have more money, but that they spend a good amount of it (50%). Furthermore, there are likely many households way above this due to low levels of liquidity and have also become lower income due to turbulence in the unemployment rate over the past year (14% in March 2020 and approximately 6% in February 2021) (“Civilian unemployment rate”), that these stimulus checks will be reinvested heavily into the economy, and allow for many revolutions of continual reinvestment throughout. While monetary policy shifts the LM curve, an expansionary fiscal policy like the stimulus checks shifts the IS curve right-ward. Essentially, the checks act as ‘negative taxes’ to income, which shows an increase in output at any interest rate. The following graph demonstrates this outward shift in conjunction with the downward shifting LM curve due to expansionary monetary policy:
(Blanchard 99)


         Now that we have covered both the recent monetary and fiscal policies (the combination of the two is called a policy mix) enacted in response to the economic downturn of the pandemic, we now have context for adequately answering our question: should we be more concerned about inflation? The Federal Reserve targets an inflation rate of 2% (“How much”); in February, the rate rose to approximately 1.7% (some of the inflation effects are due to decreased prices last year) (“How much”). The expansionary policies, especially the stimulus checks, create the possibility for a large consumer expenditure boom that could create more inflation. Referencing our textbook, we can consider this in the context of two concepts: Okun’s Law and the Phillips Curve. Per Okun’s Law, should the economy grow, the change in the unemployment rate goes down, eventually leading to a negative change in unemployment somewhere around 3% output growth (Blanchard 34). On the Phillips Curve, should unemployment decrease significantly, we would then see a rise in inflation (Blanchard 35). This is where the concern lies: that should the economy ‘overheat’ due to two large expansionary policy measures, there could be significant inflation. The Federal Reserve, however, can respond to inflation by implementing a contractionary monetary policy that increases the interest rate. In the IS-LM model, this would shift the LM curve upwards, thus decreasing equilibrium economic output. This is because when interest rates are higher, taking loans would cost more, leading to fewer loans being taken overall, and fewer projects are taken on which could have had net benefits at lower costs. As this lessens economic output, it would have the opposite effect on inflation as our policies earlier: it would lower inflation. The consequential reduced economic output is a significant tradeoff; it would result in increased unemployment, leading to individuals losing their jobs and households losing their income. This could potentially extend or recreate the recession we are currently in. Therefore, The Federal Reserve may not choose to intervene unless the inflation rate reaches 2%, instead prioritizing economic growth for the time being. If the Federal Reserve does choose to increase interest rates in the future in response to a large consumption expenditure boom, there remains the potential for increased economic output in comparison to the recession of 2020.  As we are coming out of a pandemic, however, and are attempting to combat its negative economic effects, consider a few things: (1) with the worst likely over, consumers may come to accept such contractionary policies as the worst darkness (social isolation, unemployment etc.) has passed, and (2) as the contractionary policy would coincide with fiscal policy, it could very well be a net growth over time in economic output while implementing such a contractionary policy:


Additionally, it would not simply be a decrease in economic output to stave off inflation, but would be done within an expansionary era. In essence, not only does the Federal Reserve think inflation will be temporary, but the Fed has tools to combat it, tools which, though (perhaps) less accepted in prior times, may lead to less social upheaval now than it would have after only the 2008 recession. 


Bibliography

Baker, Scott, et. al. “Income, Liquidity, and the Consumption Response to the 2020 Economic Stimulus Payments.” National Bureau of Economic Research, 15 Sept. 2020, nber.org/system/files/working_papers/w27097/w27097.pdf Accessed 18 Mar. 2021.


Blanchard, Olivier. “Macroeconomics.” 7th edition, Pearson Education, Inc., 2017. Accessed 18 Mar. 2021. “Civilian unemployment rate.” Graphics for Economic News Releases, U.S. Bureau of Labor Statistics, bls.gov/charts/employment-situation/civilian-unemployment-rate.htm. Accessed 18 Mar. 2021.


“Effective Federal Funds Rate.” Economic Research, Federal Reserve Bank of St. Louis, fred.stlouisfed.org/series/FEDFUNDS. Accessed 18 Mar. 2021.


“How much of a worry is inflation?” The Economist explains, The Economist, economist.com/the-economist-explains/2021/03/11/how-much-of-a-worry-is-inflation. Accessed 18 Mar. 2021.


Karger, Ezra, and Aastha Rajan. “Heterogeneity in the Marginal Propensity to Consume: Evidence from Covid-19 Stimulus Payments (REVISED October 2020).” Federal Reserve Bank of Chicago, May 2020, chicagofed.org/publications/working-papers/2020/2020-15. Accessed 18 Mar. 2021.


“Powell: Higher Inflation Temporary, No Rate Hikes in Sight.” US News, 4 Mar. 2021, usnews.com/news/business/articles/2021-03-04/powell-higher-inflation-temporary-fed-will-be-patient. Accessed 18 Mar. 2021.


Pramuk, Jacob. “House passes $1.9 trillion Covid relief bill, sends it to Biden to sign.” CNBC, 10 Mar. 2021. Accessed 18 Mar. 2021.